Time vs. Computer Experience
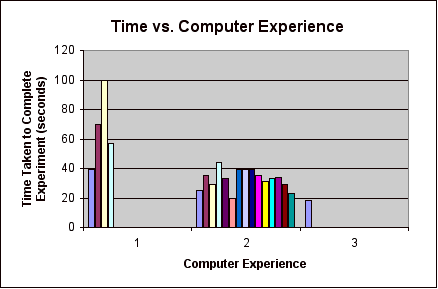
These are the average times taken for each type of computer experience:
First
time user: none
Irregular User: 66.5 S
Regular User: 32.57 S
Expert User: 18 S
Looking at this data we can see that there is a correlation between time taken to complete the experiment and computer experience. Excluding the first time user (since there were none), the time taken to complete the experiment decreases as the computer experience increases.

Time vs. Age
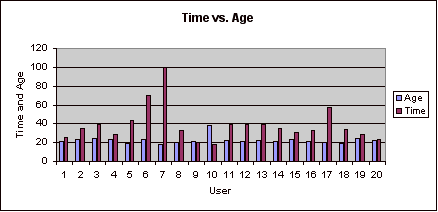
Looking at the graph, we can see no correlation between time and age. This could be due to the fact that our sample was mostly made up of students between the ages of 20-24.

Time vs. Sex
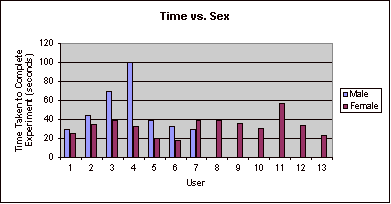
The average time taken to complete the experiment by males was 49.14 seconds and by females 32.96 seconds. From this we can conclude that females, on average, took less time to complete the experiment than males.
